Nine Power BI reports that found what the averages were hiding
Every team had a number they trusted, and every number was hiding something. Each report starts with the headline and gets you to the cause in a couple of clicks.

- Reports
- 9 live in Power BI
- For
- Marketing, ops, commercial, CRM
- Sources
- Shopify, Amazon, Google, Bing, Meta, Klaviyo, 3PL, Loop
- Replaced
- Excel extracts and six-tab lookups
The challenge
Reporting lived in spreadsheets and platform logins. Paid needed three ad platforms to judge one day's spend. Ops judged fulfilment on a seven-day average. Commercial treated hitting the unit forecast as a win. Customer service needed six tabs to answer one VIP. The headline numbers looked fine. The problems were sitting one level down.
The reports
One report per question, grouped by the team that asks it. Tap any report to see what it showed.
Paid marketing performance
Did yesterday's spend make money?
Paid can't tell if yesterday's spend made money without three ad platforms and a sheet.
- One view of Bing, Google and Meta: spend, contribution and ROI
- Period and year-on-year on the same KPIs
- Cut through to category, product, and day before the next burst
What it showed
£129.8k spend at £0.71 CPC, 85% impression share — and a 7.12% conversion day at £12.41 CPA.
Product performance
Which SKUs are actually making money?

Category revenue looks healthy while contribution and refunds quietly collapse underneath.
- Gross, net, contribution, units, TACoS, and refunds on one SKU row
- Compare this week, last period, last year, and a custom window
- Organic vs PPC units so you don't scale the SKU ads are propping up
What it showed
£2.96M week at 6.6% TACoS — and CM2 down from 26% last year to 9%, contribution −58% period, 6.6% refunds on 57.9k units.
Fulfilment analysis
Where are orders actually getting stuck?

Ops see a seven-day average and miss the warehouse, the courier, and the country that actually broke.
- Split warehouse processing from courier transit
- Compare weekdays, warehouses, and carriers
- Filter by market, order type, and cancellation reason
What it showed
46k orders, 97.5% delivered — but Friday warehouse time is ~6 days versus ~1.2 mid-week, and Norway ran to 25 days on courier.
Returns analysis
Why is it really coming back?

A 10% return rate is treated as “the category” instead of one reason, one colourway, and one size pattern.
- Rate by product, not just a headline %
- Rank reasons — fit, function, look, shipping
- Spot the colourway that’s quiet vs the one that’s a leak
What it showed
“Didn’t fit” dominates the treemap: 775 units too big vs 10 too small. One colourway at 3% returns, another at 9%; shipping-delay returns are a handful.
Stock movement
Can ops act before the buy is late?
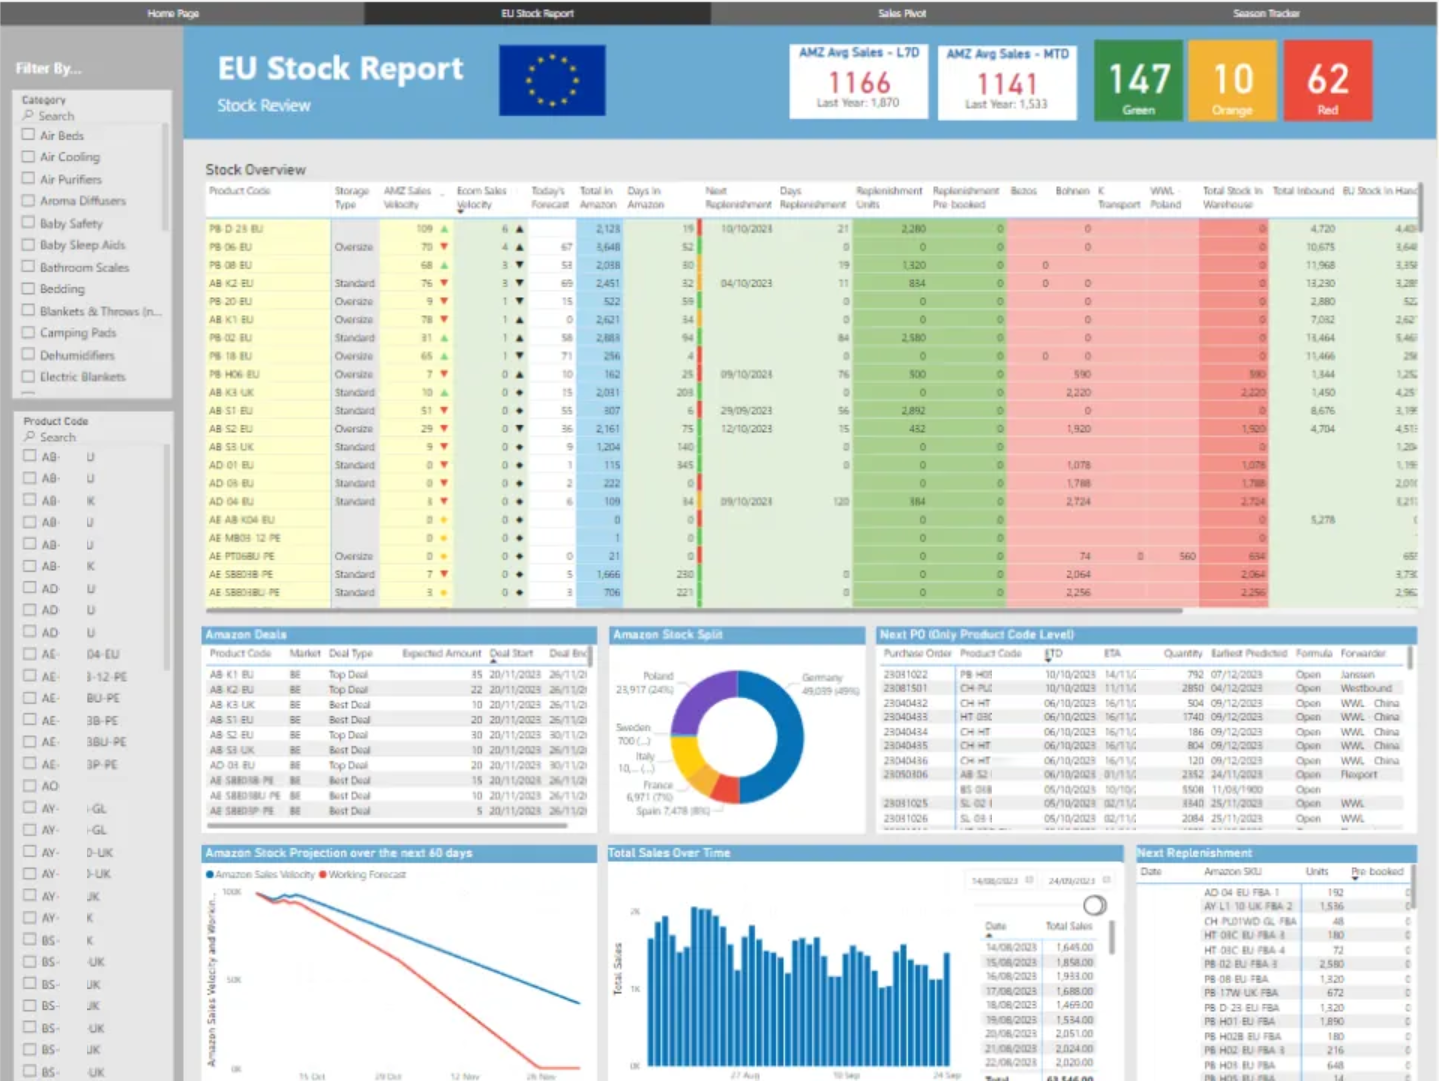
Ops find out about stock movement after the window to act has already closed.
- One view of stock movement across the brands
- Give ops a head start on the next buy, hold, or move
- Stop waiting on an Excel extract that only certain laptops can open
Order search
What happened to this order?

A VIP ticket means six tabs: Shopify, the 3PL, Klaviyo, and a refund reason nobody wrote down.
- Search by order, email, product, or discount
- Line-level revenue, tax, refund, and net profit on the order in front of you
- Fulfilment, tracking, size curve, and the channel that brought them back
What it showed
One customer: 24 orders, $5.2k gross / $3.7k net, a $108 refund marked “item no longer needed,” Royal Mail Tracked 48, and the Klaviyo flow that returned them.
Amazon forecast & performance
Are we really on plan?

Hitting unit forecast is treated as a win while peak revenue and a few categories are already off plan.
- Actual vs forecast on units and revenue, monthly and daily
- Category pacing: who is +plan (stockout) and who is −plan (overbuy)
- Market pacing so a UK miss isn't averaged away by a quieter DE/FR
What it showed
Units at 101% of target while revenue was £210k / 7% light — peak came in around £12M against a £14M forecast; one category ran +379% units vs plan.
Trade overview
Is this launch really working?

A launch looks like a spike until you split store, country, category, and the returns already in the door.
- Sessions, orders, new customers, units, and Loop returns in one header
- UK / US / EU plus US state density against the activity log
- Hero SKUs with conversion and UK vs US split
What it showed
869k sessions, 18.2k orders, 9.1k new customers — US 9.7k / UK 6.0k orders, hero product at 3.5% CR on 78k sessions, 1,802 Loop returns in the same frame.
Customer breakdown (RFM)
Who actually carries the revenue?

CRM treats the file as one list while a handful of buyers carry the revenue and a larger set is already going quiet.
- Segment by recency, frequency, monetary — Champion through Inactive
- Split mix by count vs by revenue
- Open the named buyer: score, last order, spend
What it showed
Champions are 4% of customers and 19% of revenue (~$51k average). A ~$76k buyer in Needs Attention had been silent 228 days.
What made the difference
Built around the question
Each report opens on the one thing that team checks first. The detail is a click away, not a scroll away.
Split what averages blend
Warehouse vs courier, units vs revenue, organic vs paid, UK vs US vs EU. The breakdowns are where the problems show up.
One model, not six logins
Ad platforms, Shopify, Amazon, Klaviyo, 3PL and returns data feed one model, so nobody's stitching sheets together.
Off Excel, onto everyone's screen
Reports that used to live in extracts only certain laptops could open are now live for anyone who needs them.
The results
- Paid sees spend and return across every platform in one place
- Ops can name the weekday, warehouse or courier behind a delay
- Product and commercial catch margin, category and market misses before they're buried in a total
- Customer service answers a VIP query from one screen
- CRM knows which customers carry the revenue, and which ones are going quiet
Every team still gets its headline number. Now they get the reason behind it too.
Got a number you don't fully trust?
Tell me what's broken